Assembly using Velvet
Background
Velvet is one of a number of de novo assemblers that use short read sets as input (e.g. Illumina Reads), and the assembly method is based on de Bruijn graphs. For information about Velvet see this link.
In this activity, we will perform a de novo assembly of a short read set using the Velvet assembler.
Learning objectives
At the end of this tutorial you should be able to:
- assemble the reads using VelvetOptimiser, and
- examine the output assembly.
Galaxy Background
Galaxy is a web-based analysis and workflow platform designed for biologists to analyse their own data. It can be used to run a variety of bioinformatics tools. The selection of bioinformatics tools installed on the Galaxy instance we are using today caters for the analysis of bacterial genomics data sets.
Galaxy is an open, web-based platform. Details about the project can be found here.
The Galaxy interface is separated into three parts. The

Register in Galaxy
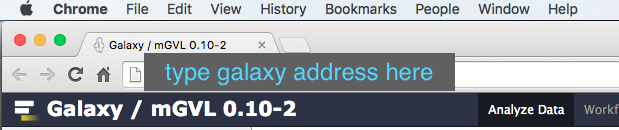
Open a new tab or window on your web browser. Use Firefox or Chrome - please don’t use Internet Explorer or Safari.
In the address bar, type in the address of your galaxy server, e.g. Galaxy Australia.
Click on
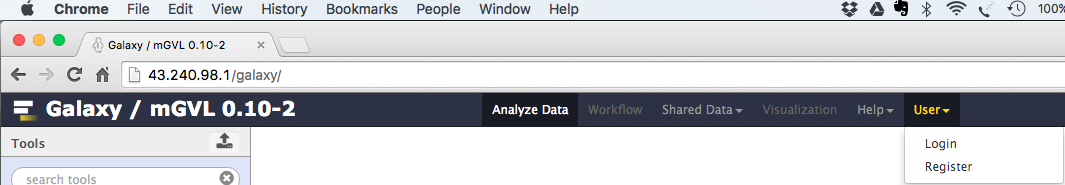
If you have never registered on this Galaxy server before:
- Select:
User → Register - Enter your email, choose a password, and choose a user name.
- Click
Submit
If you have, just login:
- Select:
User → Login - Enter your email and password.
- Click
Submit
Return to the home screen.
Import a history
- In the menu options across the top, go to
Shared Data . - Click on
Histories .

- A list of published histories should appear. Click on the history called Microbial Genomics Workshop - BINF90002
- Click on
Import history . -
An option will appear to re-name the history. We don’t need to rename it, so click
Import . -
The history will now appear in your Current History pane, and the files are ready to use in Galaxy analyses.
-
The read set for today is from an imaginary Staphylococcus aureus bacterium with a miniature genome.
-
The whole genome shotgun method used to sequence our mutant strain read set was produced on an Illumina DNA sequencing instrument.
-
The files we need for assembly are the
mutant_R1.fastq andmutant_R2.fastq . - The reads are paired-end.
-
Each read is 150 bases long.
-
The number of bases sequenced is equivalent to 19x the genome sequence of the wildtype strain. (Read coverage 19x - rather low!).
- Click on the View Data button (the
 ) next to one of the FASTQ sequence files.
Assemble reads with Velvet
Everyone will be assigned a value of k (k-mer length) to use in their assembly with Velvet. We will then populate a spreadsheet with result metrics from all of the different assemblies. The spreadsheet can be found here. Please put your name in a blank space in the Name column of the spreadsheet and note the value for k next to it.
- We will perform a de novo assembly of the mutant FASTQ reads into long contiguous sequences (in FASTA format.)
- Velvet requires the user to input a value of k for the assembly process. K-mers are fragments of sequence reads. Small k-mers will give greater connectivity, but large k-mers will give better specificity.
- Go to
Tools → NGS Analysis → NGS: Assembly → velvet -
Set the following parameters (leave other settings as they are):
K-mer : Enter the value for k that you have been assigned in the spreadsheet.Input file type : FastqSingle or paired end reads : PairedSelect first set of reads :mutant_R1.fastq Select second set of reads :mutant_R2.fastq
-
Your tool interface should look something like this (you will most likely have a different value for k):
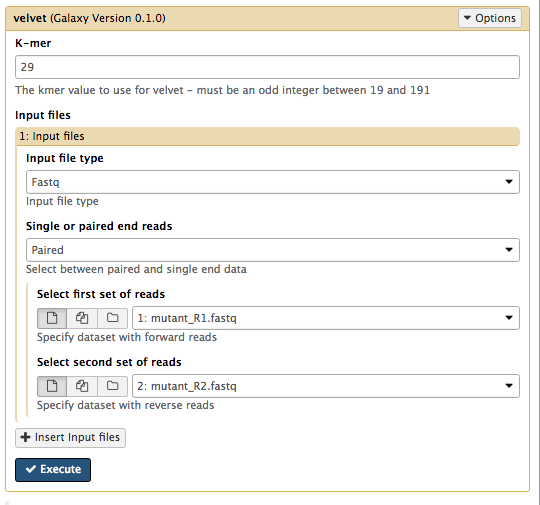
- Click
Execute
Examine the output
- Galaxy is now running velvet on the reads for you.
- Press the refresh button in the history pane to see if it has finished.
-
When it is finished, you will have four new files in your history.
- a
Contigs file - a
Contigs stats file - a
LastGraph file - the velvet
log file
- a
-
Click on the View Data button
on each of the files. -
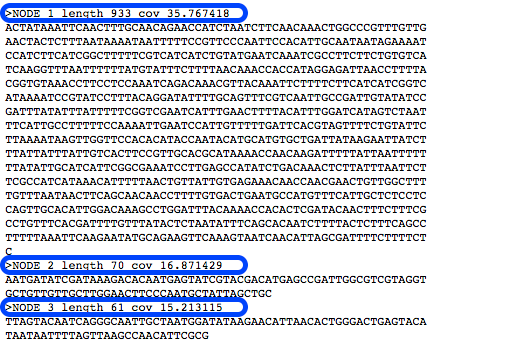
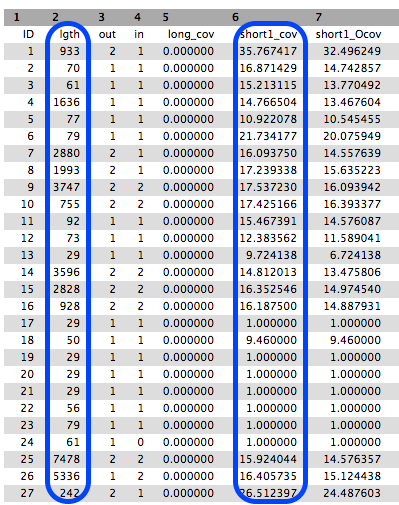
The
Contigs file will show each contig with the k-mer length and k-mer coverage listed as part of the header (however, these are just called length and coverage).- K-mer length: For the value of k chosen in the assembly, a measure of how many k-mers overlap (by 1 bp each overlap) to give this length.
- K-mer coverage: For the value of k chosen in the assembly, a measure of how many k-mers overlap each base position (in the assembly).
- The
Contigs stats file will show a list of these k-mer lengths and k-mer coverages.
- We will summarise the information in the
log file.
Collect some statistics on the contigs.
- Go to
NGS Common Toolsets → FASTA manipulation → Fasta statistics - For the required input file, choose the velvet
Contigs file. - Click
Execute . - A new file will appear called
Fasta summary stats - Click the eye icon to look at this file. (It will look something like - but not exactly like - this.)
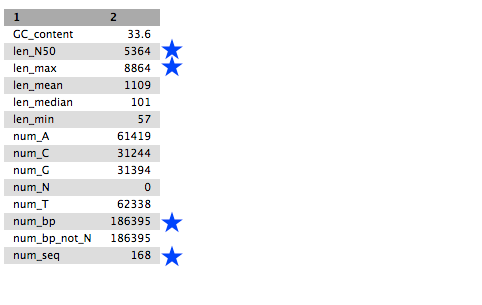
- Look at:
- num_seq: the number of contigs in the FASTA file.
- num_bp: the number of assembled bases. Roughly proportional to genome size.
- len_max: the biggest contig.
- len_N50: N50 is a contig size. If contigs were ordered from small to large, half of all the nucleotides will be in contigs this size or larger.
Now copy the relevant data back into the k-mer spreadsheet on your line.
Along with the demonstrator, have a look at the effect of the k-mer size on the output metrics of the assembly. Note that there are local maxima and minima in the charts. What do you think is happening here? Why is the value of k (the k-mer size) having an effect?
Assembly with Velvet Optimiser
Now that we have seen the effect of k-mer size on the assembly, we will run the Velvet Optimiser to automatically choose the best k-mer size for us. It will use the “n50” to determine the best k-mer value to use. It then performs the further graph cleaning steps and automatically chooses a bunch of other parameters for velvet. We should get a much better assembly result than we did with our attempts with Velvet alone..
- Go to
Tools → NGS Analysis → NGS: Assembly → Velvet Optimiser -
Set the following parameters (leave other settings as they are):
Start k-mer size : 45End k-mer size : 73Input file type : FastqSingle or paired end reads : PairedSelect first set of reads :mutant_R1.fastq -
Select second set of reads :mutant_R2.fastq -
Click
Execute
Look at the fasta statistics for the Velvet Optimiser contigs
Use the Fasta Statistics tool you used earlier to summarise the Velvet Optimiser output. Examine the resulting table. What are the main differences?
Have a look at the Velvet Optimiser log file, it’s hidden. Click on the hidden link at the top of the History pane. You’ll then need to examine its STDERR output by clicking on the name of the file, then the “i” icon, then stderr.
Can you find which k value VelvetOptimiser used for its final assembly? You should also notice that it set another couple of parameters, the expected coverage and the coverage cutoff. Any ideas what these are? See the Velvet paper or the Velvet manual for details on these parameters.